2. Introduction to Dynamic and Reproducible Report
 Image credit: Unsplash
1 What do Dynamic and Reproducible Reports mean?
Have you ever submittted a manuscript to a journal or thesis to your supervisor, or financial report to your boss, or something similar to these? If the answer is yes, we believe you have got some sort of corrections or suggestions to make some changes. These changes may take as much time as writing the original report. Assume that your journal editor asks you to change your bibliography style from APA to Chicago, or to some other weird style and at the same you are asked to change the decimal points of your table figures from 2 to 3. This will take a lot of time if your report is NOT dynamic.
Dynamic report means that every part of your report is linked to other parts, and vice versa. For this reason, changing the bibliographic style and the number of decimal points in a table or any part of the document will take you less than a minute! Another dimension of dynamic report is the ability to produce different output formats (html, pdf, docx, epub, and so on) from the same content.
The research community are not only inerested in the research results, but also the reproducibility of results. The world has changed from asking “Please, how did you do it?” to “Please give me the code”. Reproducible report simply means that everyone can generate (reproduce) your report exactly, given that they have access to and can run your code on their machine successfuly.
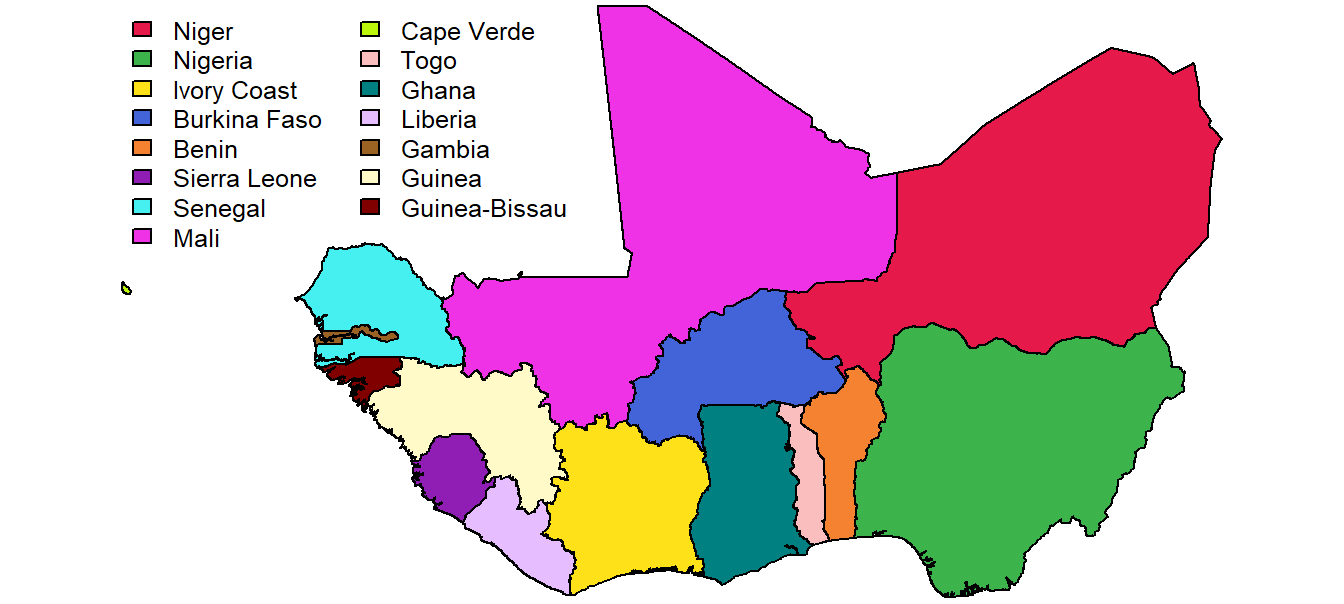
We think it is a good idea to give an example using the map of West Africa. We believe it will be difficult, if not impossible, to reproduce the following map exactly if people do not have access to the code that produces it. It will take a lot of effort, time and energy to produce something close to the map shown in Figure 1.1 .

Figure 1.1: Map of ECOWAS countries
However it will take few seconds for everyone, depending on computer speed, to reproduce the map (Figure 1.1) if s/he uses the following set of codes.
library(maps)
library(mapdata)
col_vector<-c('#e6194b', '#3cb44b', '#ffe119', '#4363d8', '#f58231', '#911eb4', '#46f0f0', '#f032e6', '#bcf60c', '#fabebe', '#008080', '#e6beff', '#9a6324', '#fffac8', '#800000', '#aaffc3', '#808000', '#ffd8b1', '#000075', '#808080', '#ffffff', '#000000')
ECOWAS=map("worldHires",region=c("Niger","Nigeria","Ivory Coast","Burkina Faso","Benin","Sierra Leone","Senegal","Mali","Cape Verde:Sao Tiago","Togo","Ghana","Liberia","Gambia","Guinea","Guinea-Bissau"),exact=T,fill=TRUE,col=col_vector,bty = "n",mar=c(0,0,0,0))
legend("topleft",c("Niger","Nigeria","Ivory Coast","Burkina Faso","Benin","Sierra Leone","Senegal","Mali","Cape Verde","Togo","Ghana","Liberia","Gambia","Guinea","Guinea-Bissau"),ncol= 2,cex = 0.77,fill = col_vector,bty = "n")
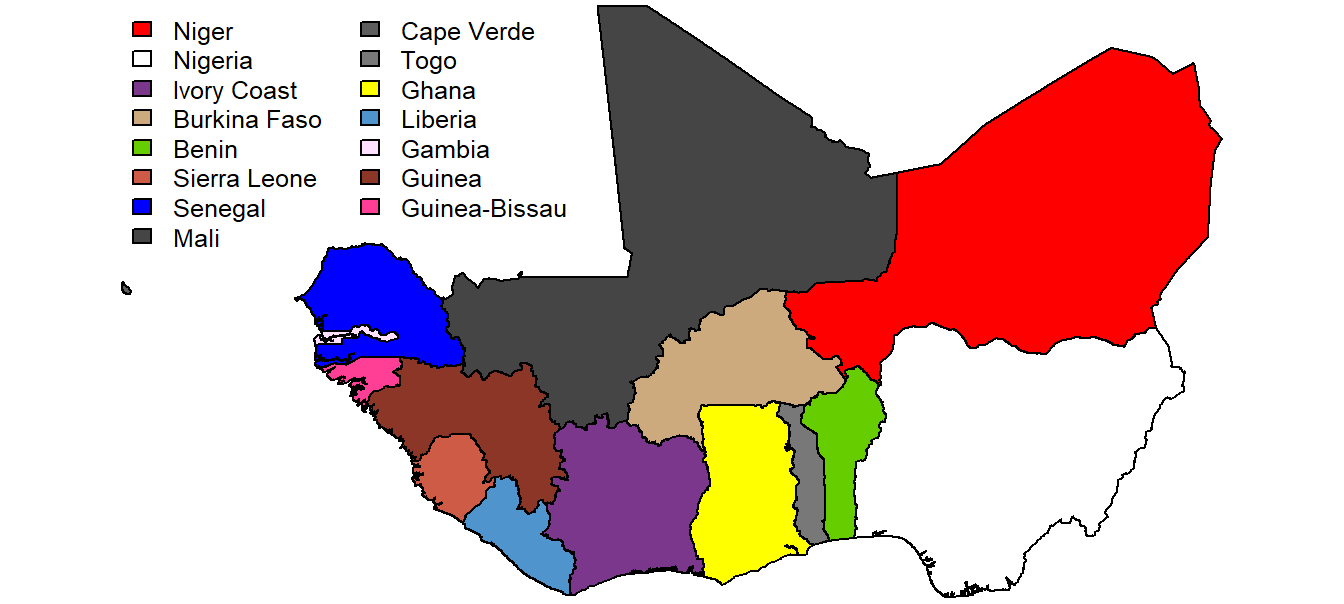
What do you think if you get some corrections/suggestions to modify the color legend(s) of some or all of the countries on the map in Figure 1.2 , for example:

Figure 1.2: Map of ECOWAS countries
That’s so easy, all it takes is few seconds if you run the following codes in R.
library(maps)
library(mapdata)
col_vector<- colors()[c(seq(450,470, by=8),seq(40,60, by=10),seq(170,200,by=10),seq(610,650,by=8))]
col_vector[1]="red"
col_vector[2]="white"
col_vector[7]="blue"
col_vector[11]="yellow"
ECOWAS=map("worldHires",region=c("Niger","Nigeria","Ivory Coast","Burkina Faso","Benin","Sierra Leone","Senegal","Mali","Cape Verde:Sao Tiago","Togo","Ghana","Liberia","Gambia","Guinea","Guinea-Bissau"),exact=T,fill=TRUE,col=col_vector,bty = "n",mar=c(0,0,0,0))
legend("topleft",c("Niger","Nigeria","Ivory Coast","Burkina Faso","Benin","Sierra Leone","Senegal","Mali","Cape Verde","Togo","Ghana","Liberia","Gambia","Guinea","Guinea-Bissau"),ncol= 2,cex = 0.77,fill = col_vector,bty = "n")
Figures 1.1 and 1.2 show how creating map of West Africa is Dynamic and Reproducible.
2 Why Should Reports be Dynamic and Reproducible?
It is known fact that some journals require the authors of a manuscrtipt to send the codes of their data analysis as a condition for accepting their manuscript. The reason is to ensure REPRODUCIBILITY of the results. For this, it is obvious that you cannot get your article(s) published if your results are not reproducible.
The main reason to make your reports dynamic is that you save a lot of time and energy in modifying the style of your report. Changing referencing style is the common modification in the process of publishing an articles.
Therefore it is good to make your report dynamic and reproducible.
3 Tools for Dynamic and Reproducible Reports
To some extent, Latex (\(\LaTeX\)), Microsoft Office Word, LibreOffice and OpenOffice can make reports dynamic and reproducible. However, their capacity is limited as they make no provisions for inline codes.
Other tools of dynamic and reproducible reports include SASDown by Statistical Analysis Software (SAS), Stata Markdown introduced in Stata 16. The limitations of these tools include inability to work (communicate) with other programming languages or statistical softwares. For example, Stata cannot work in tandem with SAS or C++ to make dynamic and reproducible reports, and the reverse is true.
On the other hand, R and R Markdown provided by the Integrated Development Environment Rstudio offer the possibility of making reports dynamic and reproducible, and can communicate with other statistical softwares or other programming languages. Thanks to knitr package created by Yihui Xie (see Xie, 2019, 2014, 2015)
4 Why Eviews, R and R Markdown?
We have chosen to work with Eviews on this Blog as it is one of the popular statistical tools for timeseries and panel data analyses. Moreover, its learning curve is not steep (we will learn the basics of Eviews programming before integrating it in R Markdown). Additionally, we are yet to see any blog, book or serious academic article written purposely to integrate Eviews in R Markdown.
R and R Markdown are necessary tools for dynamic and reproducible reports as they can set up to commmunicate with Eviews. Moreover, the first two tools are free and open-source and license of Eviews is relatively low, especially for students.
In order to read more about me, please VISIT OUR BLOG, which we created purposely for those interested in learning Dynamic and Reproducible reports using Eviews, R and R Markdown.
Please feel free to post questions, comments, suggestions and/or corrections on the Blog.
References
Xie, Y. (2014). Knitr: A comprehensive tool for reproducible research in R. In V. Stodden, F. Leisch, & R. D. Peng (Eds.), Implementing reproducible computational research. Retrieved from http://www.crcpress.com/product/isbn/9781466561595
Xie, Y. (2015). Dynamic documents with R and knitr (2nd ed.). Retrieved from https://yihui.name/knitr/
Xie, Y. (2019). Knitr: A general-purpose package for dynamic report generation in r. Retrieved from https://yihui.name/knitr/